






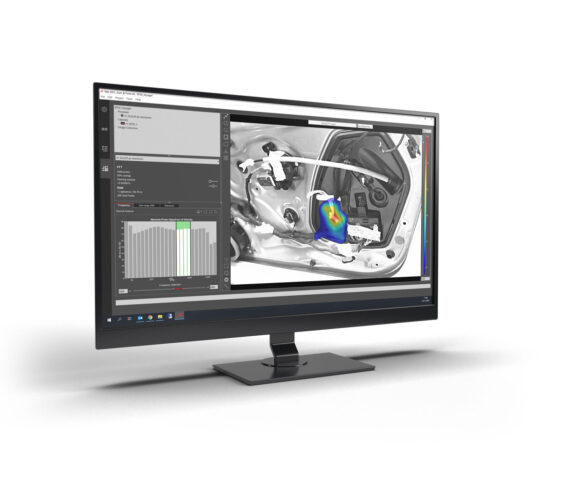
In most practical scenarios, anechoic conditions are unavailable, such as industrial production workshops, engine compartments and vehicle interiors. The PU probe is immune to high background noise and acoustic reflections, making it suitable for measurement environments with intense sound pressure levels. It directly measures sound pressure, particle velocity, sound intensity, sound power and acoustic impedance.
The scanning imaging system boasts user-friendly operation: simply scan the surface of the test object with the PU probe while capturing footage of the surface via the integrated camera. The recorded audio and video data are automatically synchronized and processed by the software. During post-processing, the built-in auto-tracking function identifies marker positions on the probe automatically. At each measurement point, particle velocity, sound intensity and sound pressure are calculated against time-segment data corresponding to coordinates, generating high-resolution color sound distribution maps. The whole measurement and processing procedure only takes several minutes. The software is equipped with abundant advanced functions, including octave-band display, filtered audio playback for selected regions, spectrum analysis and sound power calculation.
The scanning imaging system delivers a fast, easy near-field scanning solution for sound source localization. Audio and video streams are recorded synchronously, with a full suite of analysis tools available: averaged spectra, spectrograms, multi-octave band display, frequency weighting and more.
Core Features
- ■ Frequency range: 20 Hz – 10 kHz
- ■ Rapid measurement with short processing time
- ■ Immune to background noise and acoustic reflections
- ■ No anechoic chamber or quiet test environment required
- ■ Automatic synchronization of measurement data and video
footage
- ■ High-resolution acoustic mapping
- ■ Calculation of sound pressure, particle velocity, sound
intensity, absorption coefficient (matched with in-situ absorption
accessories) and sound power
- ■ Frequency-filtered audio playback
- ■ All-in-one single-sensor solution
Particle Velocity Measurement Principle
■ Two platinum wires are heated to approximately 200°C.
■ Air flows past the first wire, heating up the airflow and cooling the platinum wire.
■ The warmed air continues to pass over the second wire, which cools down to a lesser extent than the first wire.
■ The temperature difference between the two wires triggers resistance variation.
■ Resistance fluctuation generates voltage changes, from which particle velocity is derived.
3D Scanning Imaging & Measurement Equipment
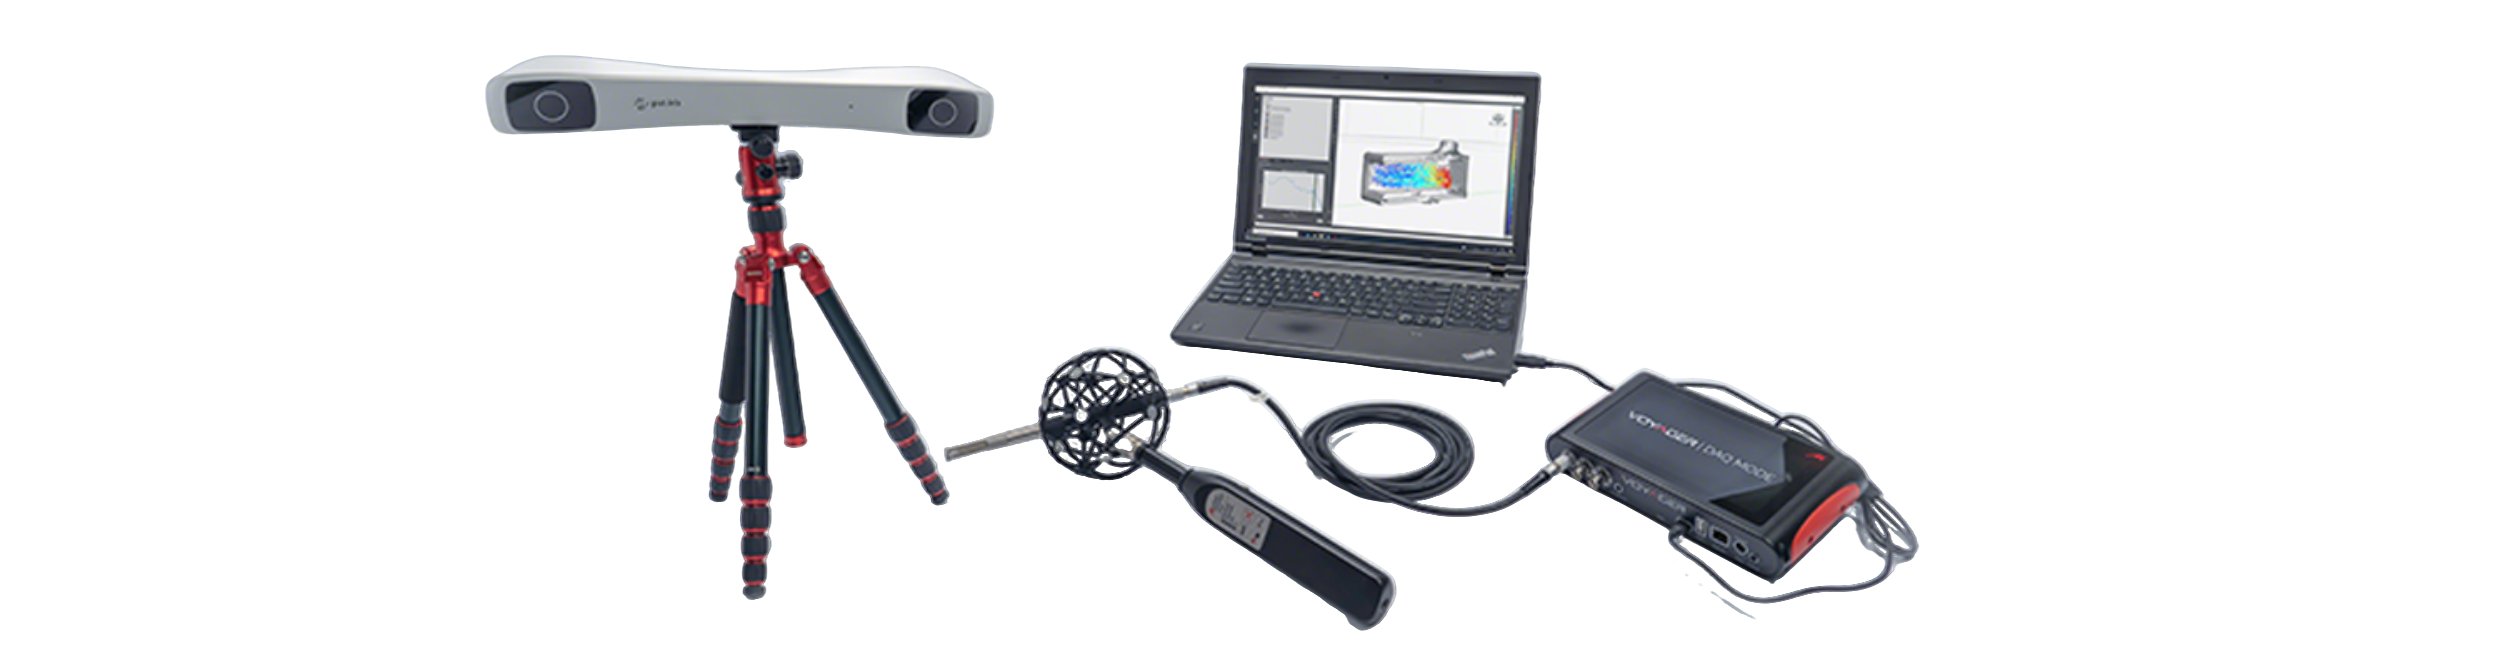
Key Capabilities
- ■ 3D visualization function
- ■ Sound intensity vector display
- ■ Particle velocity vector display
- ■ Sound pressure measurement: near-field & far-field,
full sound field visualization
- ■ Sound power calculation: fast measurement, tracking and
data processing
- ■ Optimized for on-site in-situ testing
- ■ Broad frequency band: 20 Hz – 10 kHz
- ■ 3D visualization function


 Please leave your contact information, and we will get back to you as soon as possible!